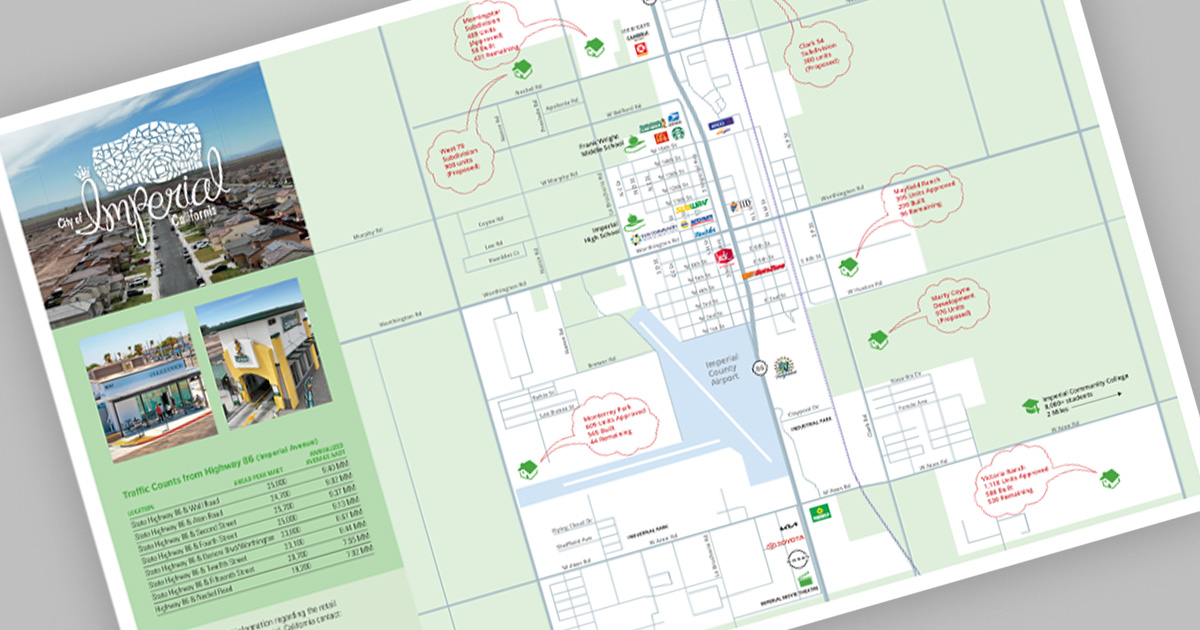
At Hunter|Johnsen, we believe every city has a story to tell—one of progress, possibility, and promise. Working in collaboration with Development Management Group (DMG), we help communities like the City of Imperial and the City of Needles bring those stories to life through economic development maps and data sheets—tools that blend data, strategy, and design.
These tools do more than display streets and intersections. They visualize a city’s momentum—highlighting key features such as new housing developments, retail and franchise locations, hotels, schools, parks, infrastructure investments, and major employers. They also include vital traffic data that demonstrates customer access and visibility—essential information for developers and national brands evaluating new markets.
For these cities, where thriving new subdivisions, retail expansion, and infrastructure projects signal strong growth, these tools tell a story of opportunity. It reflects community reinvestment, with millions of dollars in new parks, hotels, and infrastructure already transforming the landscape.
City leaders and their consultants find them useful for conferences and other national and regional gatherings—using them as visually engaging conversation starters to attract retailers, investors, and developers. They serve as a snapshot of progress and a roadmap for future investment.
Our team at Hunter|Johnsen works closely with DMG and city partners to design these visual storytelling communication pieces that help cities share their success—and invite new businesses to become part of their next chapter of growth.
Because when it comes to economic development, a great map doesn’t just show where a city is—it shows where it’s going.
If you’d like to find out more about what we can do for you, we’d love to hear from you. Connect with us here.